Distributed Tracing: Guide to Monitoring Microservices
- Gunashree RS
- Sep 20, 2024
- 8 min read
As software architectures have evolved from monolithic applications to microservices, the complexity of managing and monitoring these distributed systems has increased. In this new environment, tracking requests and identifying performance bottlenecks across multiple services becomes challenging. This is where distributed tracing comes into play.
Distributed tracing is an essential tool for gaining visibility into the life cycle of requests within a distributed system. It allows engineers to track how a request flows through multiple services, making it easier to debug issues, optimize performance, and understand complex interactions.
In this detailed guide, we'll explore what distributed tracing is, why it's critical in microservices-based architectures, and how it works. We'll also cover key tools, best practices, and the role of distributed tracing in modern infrastructure and monitoring strategies.
1. What is Distributed Tracing?
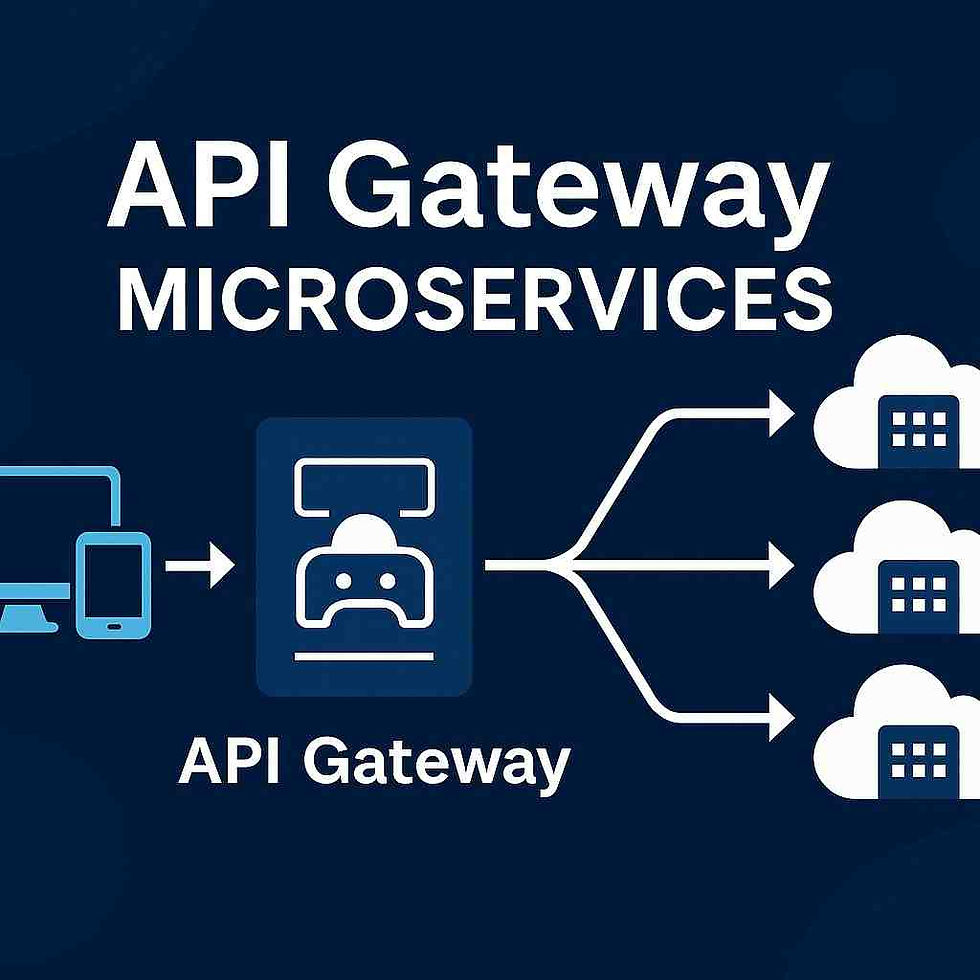
Distributed tracing is a method for tracking requests as they move through a distributed system, such as a microservices-based application. It allows engineers to monitor the entire life cycle of a request, from its entry into the system (e.g., an API gateway) to its interaction with multiple services, databases, and other dependencies.
A distributed trace follows the journey of a request, collecting data from each service it interacts with, which is referred to as a span. Spans are then linked together with a unique trace ID, enabling engineers to see how a single transaction flows through the entire system, making it easier to identify bottlenecks or failures.

2. Why Distributed Tracing Matters
As organizations move away from monolithic applications and adopt microservices architectures, the operational complexity of managing and debugging applications increases. Traditional monitoring tools, which are often effective in monolithic environments, fail to provide sufficient insight into modern distributed systems.
In a distributed architecture, a single user request could traverse multiple services, databases, and external APIs. Without distributed tracing, it becomes challenging to determine which service or component is causing slowdowns, errors, or bottlenecks.
Distributed tracing solves this problem by giving visibility into the life cycle of each request. It helps engineers answer critical questions, such as:
How long does each service take to process a request?
Where are the slowdowns or bottlenecks in the system?
What happens to a request as it travels between services?
With distributed tracing, teams can pinpoint exactly where issues arise in their distributed systems and resolve them faster.
3. Challenges in Distributed Systems
In distributed systems, two significant challenges arise: networking and observability.
3.1 Networking
In monolithic applications, managing networking is straightforward. The path between the client and server is typically linear, allowing for easy control over connectivity, performance, and security. However, in distributed systems, where services communicate over a network, the complexity increases significantly.
Each service must communicate with multiple other services, databases, and third-party APIs, often across different regions. This creates a convoluted web of interactions, making it difficult to monitor network latency, failures, and overall performance.
3.2 Observability
Observability refers to the ability to understand the internal state of a system based on its external outputs. In monolithic systems, this is relatively simple because all processes run in a single environment. However, in distributed systems, requests are scattered across multiple services, databases, and infrastructures, making observability much more difficult.
Without tools like distributed tracing, tracking the flow of a request through various services is tedious and error-prone.
4. Distributed Tracing in Action
Distributed tracing works by tracking the lifecycle of a request, breaking it down into traces and spans.
4.1 Traces and Spans Explained
Trace: A trace represents the complete journey of a request through the system. It consists of multiple spans, each representing an interaction between services.
Span: A span is the primary unit of work in distributed tracing. It represents a single operation, such as an HTTP request or a database query. Each span records the start and end time of the operation and is linked to other spans via a unique trace ID.
4.2 How a Trace Works
Here’s an example of how a trace works in a distributed system:
The client initiates a request (a0): The client sends an HTTP request to a service (Service A).
Request flows through multiple services: Service A processes the request, and makes a call to Service B, which in turn interacts with Service C.
Each interaction is recorded as a span: For each service interaction, a span is created, capturing the timing and any additional metadata.
Spans are linked by a trace ID: All spans related to this request share the same trace ID, allowing engineers to see the entire flow from start to finish.
This creates a clear picture of how a request moves through the system, highlighting which services are taking the most time or where errors occur.
5. Distributed Tracing vs. Traditional Monitoring
Traditional monitoring tools like metrics and logs are effective for understanding specific aspects of a system's performance but fall short of providing a complete view of request flows in distributed systems.
Metrics: Provide aggregate data such as CPU usage, memory, or request rates, but don’t offer details on individual requests.
Logs: Offer insights into specific events but can be overwhelming and hard to correlate across multiple services.
Distributed tracing, on the other hand, offers a holistic view of the journey of individual requests across services, making it easier to debug and optimize distributed systems.
6. Tools for Distributed Tracing
Several tools and frameworks are available for implementing distributed tracing. These tools collect and visualize trace data, helping engineers understand the flow of requests and identify performance issues.
6.1 Zipkin
Zipkin is a distributed tracing system initially developed by Twitter. It helps gather trace data and provides a user interface for querying and visualizing the traces. Zipkin is designed to be lightweight and easy to integrate with different services.
Key Features:
Supports multiple backends (Cassandra, Elasticsearch)
Can be integrated with services using HTTP, Kafka, or gRPC
Offers a web-based UI for viewing traces
6.2 Jaeger
Jaeger was developed by Uber and is a popular open-source tracing tool. Jaeger is part of the Cloud Native Computing Foundation (CNCF) and supports OpenTracing, making it compatible with many platforms.
Key Features:
Distributed context propagation and performance monitoring
Advanced sampling strategies to control the volume of trace data
Compatible with OpenTracing standards
6.3 Appdash
Appdash, developed by Sourcegraph, is another open-source tracing tool that supports OpenTracing. While not as mature as Zipkin or Jaeger, it provides a basic framework for capturing trace data.
Key Features:
Lightweight, Go-based architecture
Basic tracing features with OpenTracing support
Suitable for smaller or less complex systems
7. Open Standards for Distributed Tracing
Several open standards exist for distributed tracing, ensuring that tracing tools and frameworks are compatible across different systems and vendors.
7.1 OpenTracing
OpenTracing is a popular open-source standard for distributed tracing. It provides a set of APIs that allow developers to instrument their applications with trace data. OpenTracing is vendor-neutral, meaning it can work with various backends like Zipkin or Jaeger.
7.2 OpenCensus
OpenCensus is another standard for collecting traces and metrics. It originated from Google’s internal tracing system and is designed to offer cross-platform compatibility with multiple programming languages.
7.3 OpenTelemetry
OpenTelemetry is the successor to both OpenTracing and OpenCensus. It combines the best features of both frameworks and is quickly becoming the industry standard for distributed tracing and observability. OpenTelemetry provides APIs, libraries, and agents for collecting traces and metrics, making it a comprehensive solution for monitoring distributed systems.
8. How to Implement Distributed Tracing
Implementing distributed tracing involves the following steps:
Instrument your code: Use tracing libraries to instrument your services. For example, with OpenTelemetry, you can instrument HTTP requests, database queries, and other interactions to generate trace data.
Set up tracing infrastructure: Deploy a tracing system such as Zipkin or Jaeger. These systems collect trace data and provide a user interface for viewing and querying traces.
Capture and visualize traces: Use the tracing system’s UI to monitor trace data and visualize the flow of requests across services.
Analyze traces to find bottlenecks: Look for high-latency spans or errors to identify performance bottlenecks or failures in your system.
9. Best Practices for Distributed Tracing
To make the most of distributed tracing, follow these best practices:
Start small: Begin by instrumenting critical paths in your system before expanding tracing across all services.
Use consistent trace IDs: Ensure all services in your distributed system share the same trace ID for a request, enabling seamless trace correlation.
Implement sampling strategies: To avoid overwhelming your system with trace data, use a sampling strategy to collect traces for only a subset of requests.
Leverage tags and annotations: Add metadata to spans using tags and annotations to provide context and improve trace analysis.
Integrate with monitoring tools: Combine distributed tracing with metrics and logs for a comprehensive observability solution.
10. Conclusion
Distributed tracing is an invaluable tool for monitoring and debugging microservices-based systems. As modern applications grow in complexity, understanding how requests traverse multiple services is critical to maintaining performance and reliability. By leveraging distributed tracing tools like Zipkin, Jaeger, or OpenTelemetry, organizations can gain deep insights into their system’s behavior and quickly identify issues that affect end-user experience.
Whether you're adopting microservices or running a large-scale distributed system, distributed tracing offers the visibility needed to optimize performance, reduce downtime, and ensure smooth operations.
11. Frequently Asked Questions (FAQs)
Q1: What is distributed tracing?
Distributed tracing is a method of tracking the flow of requests through a distributed system, providing visibility into how individual requests interact with multiple services.
Q2: How is a trace different from a span?
A trace represents the entire life cycle of a request across multiple services, while a span represents a single operation within that trace.
Q3: What are some popular tools for distributed tracing?
Popular tools for distributed tracing include Zipkin, Jaeger, and Appdash. These tools collect, visualize, and analyze trace data.
Q4: How does distributed tracing differ from traditional monitoring?
Distributed tracing tracks individual requests across multiple services, providing a detailed view of the flow and interactions. Traditional monitoring focuses on metrics like CPU usage and memory without tracing individual requests.
Q5: What is OpenTelemetry?
OpenTelemetry is an open-source framework for collecting traces and metrics, combining the best features of OpenTracing and OpenCensus.
Q6: What is the role of trace IDs in distributed tracing?
Trace IDs are unique identifiers that link multiple spans together to form a complete trace, allowing engineers to see how a request moves through different services.
Q7: How can distributed tracing help in debugging?
Distributed tracing allows engineers to track the flow of requests and identify where errors or slowdowns occur, making it easier to debug complex distributed systems.
Q8: Can distributed tracing be used in serverless environments?
Yes, distributed tracing can be used in serverless architectures, but it requires proper instrumentation of serverless functions and third-party integrations.
12. Key Takeaways
Distributed tracing provides visibility into how requests flow through distributed systems.
Traces are composed of multiple spans, each representing a specific operation.
Distributed tracing is essential for debugging and performance optimization in microservices-based architectures.
Tools like Zipkin, Jaeger, and OpenTelemetry help collect, visualize, and analyze trace data.
Distributed tracing complements traditional monitoring tools by offering detailed insights into request flows.
Open standards like OpenTelemetry enable cross-platform tracing and metrics collection.
Proper implementation and sampling strategies are key to effective distributed tracing.
Distributed tracing is critical for observability in complex, modern software systems.


Comments